Hi, is it at all possible to apply vector symbology beyond colour? Looking to apply reverse/normal/etc fault symbology - either based on attribute or by layer.
Hi Phil,
Not currently, but we have begun overhauling the symbology system in GPlates to enable this sort of thing and should have that available next year sometime. Currently there is a limited form of symbology supported for points as mentioned in this post (where you can specify a circle/cross/square/triangle based on feature type).
Regards,
John
Thanks John, that is great news. If I can be of any assistance in testing etc let me know. Will you hook in to existing symbology functionality such as provided through qgis qml? We have a number of structure, lithology, stratigraphic age etc symbology that we could perhaps contribute.
Hi Phil,
Thanks. While our planned symbology will be similar to QGIS (in that each symbol will have user-specified layers) there are certain rendering styles/options in QGIS that don’t suit a 3D globe so well (since QGIS symbology is designed for its 2D map projections). So currently not too sure how we’ll handle importing QGIS symbols, but we’ll be looking into it in more detail once the main symbology is actually implemented in GPlates.
Hello,
Found this thread and I have a related question. Is it possible to classify the line width using a CPT file? I am trying to decrease also the arrowhead size of motion paths so I can export a decent-looking JPG instead of exporting to GMT or .shp. Or, is there a way to export reconstructed features to a vector format quickly-readable by Adobe Illustrator?
Thank you,
Brandon
No
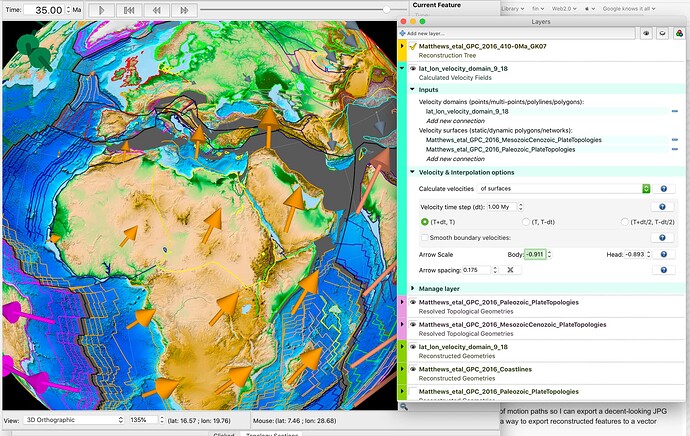
You can change the arrow scaling via the layer manager for the corresponding feature collection - in the Arrow scale part:
The alternative is to export Reconstructed geometries (*.svg, essentially the content you see on your screen) including the velocity fields and do the spicing up via a vector graphics package.
HTH,
Christian
