Variable Initial Crustal Thickness + Deforming Mesh Bugs

Hi. I am looking at crustal thickness changes, but I think currently you can only assign a constant initial crustal thickness for the entire deforming region? Is there any way you can have a variable initial crustal thickness and/or load in a grd/nc file with thickness values?

Also sometimes when I try to create a deforming mesh, I can add all of my lines to the boundary, but when I click create, no mesh appears. Is this a common bug, and are there specific types of features that must be added, or a certain way of saving the file, which can avoid this?

Thanks,
Edward

Hi Edward,

Currently you can only assign a constant initial thickness in GPlates. We plan to implement the importing of an initial thickness grid as you noted.

However in pyGPlates you can now do this and it will be available in the next release (after GPlates 2.3 is released, which is soon). You would still need to provide the point locations and initial thicknesses yourself (eg, sample a thickness grd/nc grid). Although before the release we will expose the ability to generate uniformly spaced points on the globe (ie, not just uniform lat/lon) inside a chosen deforming region (ie, polygon boundary). Which means you would just need to take those points and sample the initial thickness grid yourself.

It sounds like a problem with feature IDs of some sort. Have a look at this post, but that might not be the answer since you’re not saving and reloading. Even though the mesh does not appear, can you save the mesh to GPML and send to me along with the file(s) containing the features it references (ie, the ones you added to the mesh)?

You can add a regular feature (reconstructed by its plate ID) or reconstructed by half stage rotation (eg, mid-ocean ridge). But you cannot add a VirtualGeomagneticPole, SmallCircle, motion path or flowline.

Hi John,

Thanks for your help. For pygplates, are you referring to the MultiPointOnSphere function? I’m able to provide the point locations and thickness values, but how would I then connect this to a deforming mesh and reconstruct the thickness through time? Is there a way to create a reconstructed scalar coverage layer in pyGPlates and then load it into GPlates?

Okay, I’ve saved the files and emailed to you.

Best wishes,
Edward

Thanks for the files.

I noticed your feature IDs are all zero, which I’ve never seen before. That would explain the issue you are seeing. This is in your blocs.gpml file. Did you create it outside of GPlates/pyGPlates (as in create the XML some other way) ?

It’ll be a function that returns a MultiPointOnSphere, or a list of PointOnSphere, that is the uniform points inside the deforming network. But it won’t be available until the next release.

Have a look at this code from a version of pyBacktrack currently in development. The part that loads the initial scalars (in this case initial stretching factors) is:

initial_scalars = {pygplates.ScalarType.gpml_crustal_stretching_factor : reconstructed_crustal_stretching_factors}

…but this ability won’t be available until the next pyGPlates release.

Yes, I created the files in ArcGIS, loaded a .shp into GPlates and then saved it as a .gpml file.

And I will look forward to the next pyGPlates release! Any idea of the timescale for this?

Can you send me the Shapefile you created in ArcGIS? Thanks. And I guess the gpml file you saved was the blocs.gpml that I now have (if not could you send the GPML also).

I’m not really sure, but will know better once GPlates 2.3 has been released - even my estimate for that has not been very accurate :wink:

Thanks for sending the Shapefile.

I can see that you’ve mapped feature IDs to your Line_Numb Shapefile attribute which is zero for all your features, but GPlates requires feature IDs to be unique. This is because when the topology looks for a boundary section with feature ID 0 it will find more than one. This results in ambiguity so it chooses neither (this way it becomes more obvious that the topology is broken, rather than taking the risk of arbitrarily choosing a boundary section which could the wrong one).

I would suggest mapping your Blocs.shp again (you might need to delete the Blocs.shp.gplates.xml file to clear the current mapping) and load Blocs.shp back into GPlates again and map like this…

…noting that Feature ID: is left as <none>.

Then save it as Blocs.gpml. I know you’re not doing this, but for others if you keep loading the Shapefile (instead of GPML) then GPlates will create new feature IDs each time you load, and the topologies will not be able to find those features. This is something we need to look into when we overhaul our non-native file IO (eg, maybe we’ll create a new Shapefile attribute to store the feature ID in).

Then you can create topologies (unfortunately you’ll need to create them again).

Alternatively you could map Feature ID: to a Shapefile attribute that you know will be unique across all your features. But generally the feature ID should follow the string format that GPlates gives it (which starts with GPlates- and has alphanumeric characters and -, _ and . only). It’s best to allow GPlates to provide the feature ID (which it will do if you leave it mapped as <none>). And, as you have correctly done, we always recommend using GPML format when working with topologies (both the topologies and their referenced sections).

Great, thank you! Everything is working now.

On deforming mesh bugs, I’ve been applying them in a worldbuilding context, so I’ve found a couple bugs in how they (and topological networks) work.

The most notable one has been that deformation around the poles of the globe is just… wrong? For this, I’m using a global extent mesh, but you can also see this effect in topological networks. Values jump to both extremes for any triangles in a network that crosses over either pole. I think it has something to do with the way the math is done, like if the values are being calculated on the rectangular coordinates and aren’t getting corrected for the fact that small movements around the poles are extremely exaggerated on a rectangular view. I’ve sort of been able to solve it by having a rigid interior block that blocks the network from taking inputs around the pole, but that’s not a great solution since I want to be able to have complicated interactions anywhere on the globe, including the poles. Changing the anchored plate ID will move where the buggy regions are, which solidifies that it’s an issue with how the values are calculated. I can provide a file that exemplifies this in a PM.

Another thing is that meshes are extremely CPU intensive to generate, even though it seems like it shouldn’t be all that difficult to render (I have a pretty powerful PC, and it often takes me up to a couple minutes to generate a mesh or set of networks with natural smoothing). Getting those to render more efficiently would be a huge QOL upgrade for people who use them regularly like me.

That would be great, thanks!

We switched to an azimuthal equal area projection to get around issues at the pole, but it sounds like there could still be some issues.

Yes it’s very CPU intensive. That’s the bottleneck, as opposed to the rendering (GPU) which is quite fast in comparison.

We have plans to speed this up but it’s fairly non-trivial - each point lookup in the Delaunay triangulation is the bottleneck (even with a triangulation hierarchy) - we currently use CGAL for this. And then there’s the natural neighbour interpolation (not to be confused with nearest neighbour) for each deforming mesh point, and that requires re-triangulating the area around each point. Multiply all that by the number of points and then multiply that by the number of time steps and it really starts to add up.

Thanks for sending the files.

I see what you mean - there is some kind of pole issue still present - and, as you noted, changing the anchor plate ID highlights this.

Despite using a different projection as the base for the mesh triangulation (to avoid pole issues), we’re still calculating the spatial velocity gradients (ie, strain rate) in lat/lon space. I suspect that’s causing this issue. Thanks for pointing this out. I’ll need to look into changing that at some point. We do plan to replace CGAL at some point relatively soon (not that this is CGAL’s fault), so I’ll look into it then.

I think this issue is a lot more obvious in your data because your deforming networks appear to cover the entire globe (in your world-building context). For our deforming networks (in a geological context) it’s quite rare that an active network crosses a pole, so this probably just hasn’t been noticed yet.

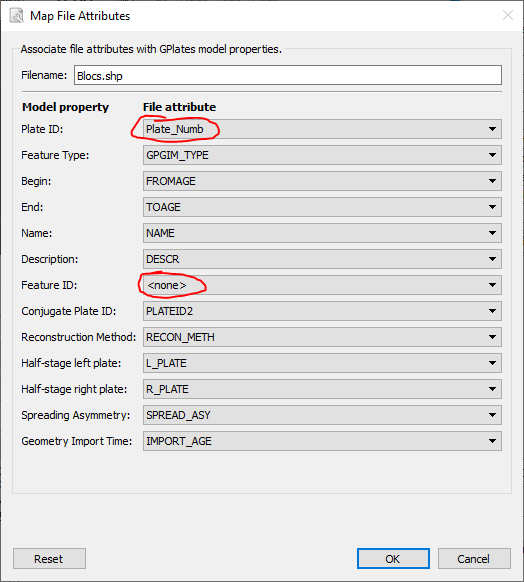
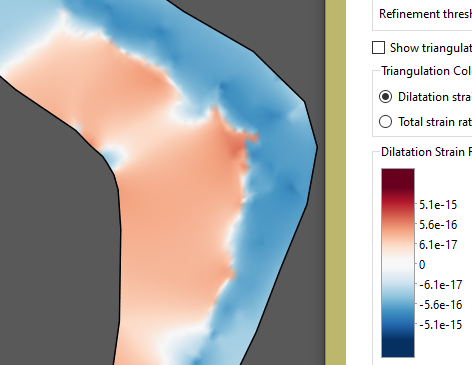
Although I just checked our networks and can see an inactive network (a region where deformation has ceased and hence should have zero deformation) that covers the North pole…

image

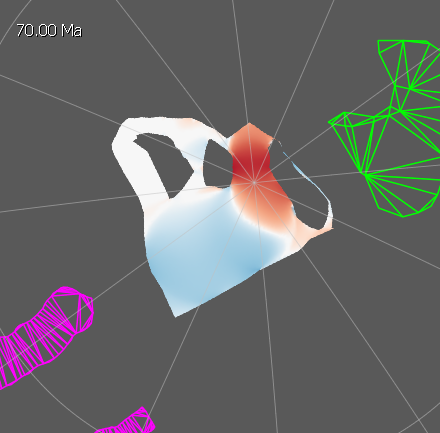
…but it should be all white (ie, no deformation). If I change the anchor plate to move it off the pole then it becomes all white as expected…

image

…but being an inactive network it’s probably not a big issue for us.

I think I misunderstood you before. I was thinking you were referring to generating deforming mesh points (under the Features > Generate Deforming Mesh Points menu) which are deformed through time by the deforming networks…

image

But, after taking a look at your files, I think you mean the actual creation of the deforming networks themselves and, as you mentioned, displaying them with natural neighbour smoothing

image

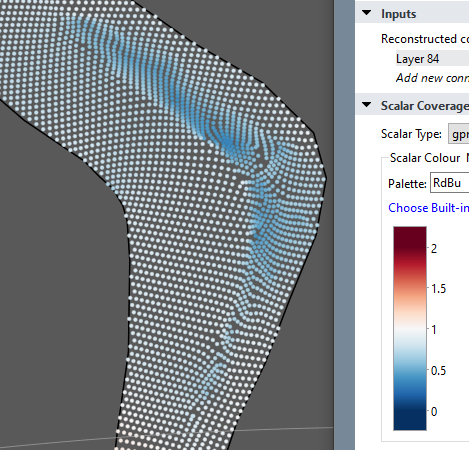
Actually the reason for the slowdown remains the same (ie, lots of points sampling the Delaunay mesh). It’s just that, in this case, the points are all the “raster” locations in the bottom screenshot (so that you can visualise the variation in strain rate) versus the explicit points in the screenshot above it.

In your case you actually have deforming meshes covering the entire globe, which I didn’t anticipate, so that would definitely slow things down. Also, as you noted, you can turn off fill mode or select no smoothing and it will be much faster.