I’m wondering if someone has developed a clever way of illustrating a GPlates reconstruction tree with data from a rotation file. I would like a neat diagram plotting the plateID hierarchy. I’ve been tooling around in python for a little while on this but finding it harder than I thought.
yes, I struggled with this some years back and James Boyden (one of the original GPlates programmers) kindly wrote a Python script (called vis-rot) in 2006 to visualise the reconstruction trees at specified times using Graphviz. I don’t think it is included with GPlates currently but as it was put under a GPL v2 I’ve converted it to Py3 and put it into a repository here: code.paleoearthlabs.org/gptools/ -
Might do the job unless @john.cannon@michaelchin or @simon.williams might have something more updated. I suppose this script could be re-written using pyGPlates.
Thanks Christian, good find! Just a quick note: I needed UTF8 to load a rotation file from the GPlates sample data (changed line 336 to rot_file = open(fname, encoding='utf8')).
For reference, James Boyden also wrote a program called ReconTreeViewer back in 2007. In fact if you look in the About dialog of GPlates you’ll see it mentioned there. That was before I started working on GPlates, so I haven’t used it, but I did notice that it can still be downloaded here. Just tried a quick compile on Ubuntu 20.04 (you need to install libopenscenegraph-dev). However, as expected, the OpenSceneGraph library interface has changed enough since 2007 that it no longer compiles (options could be to see how OpenSceneGraph has changed and tweak the ReconTreeViewer source accordingly, or somehow try to find/install an old version of OpenSceneGraph).
a suggestion along these lines - maybe both GPlates GUI as well as pyGPlates could be extended building on those two approaches to have an option to export a Graphviz/Dot file to visualise the tree at reconstruction times (or some other suited format to plot complex tree like structures)?
There’s also this from Simon Williams which is pretty cool.
Yes, an export along these lines is a worthwhile addition. On that note, we had planned for something that displays arcs between plates (their centroids) as a visual representation (on the globe) of the reconstruction tree at the current reconstruction time. You can see a similar visual representation in the bottom image in Simon’s notebook (linked above).
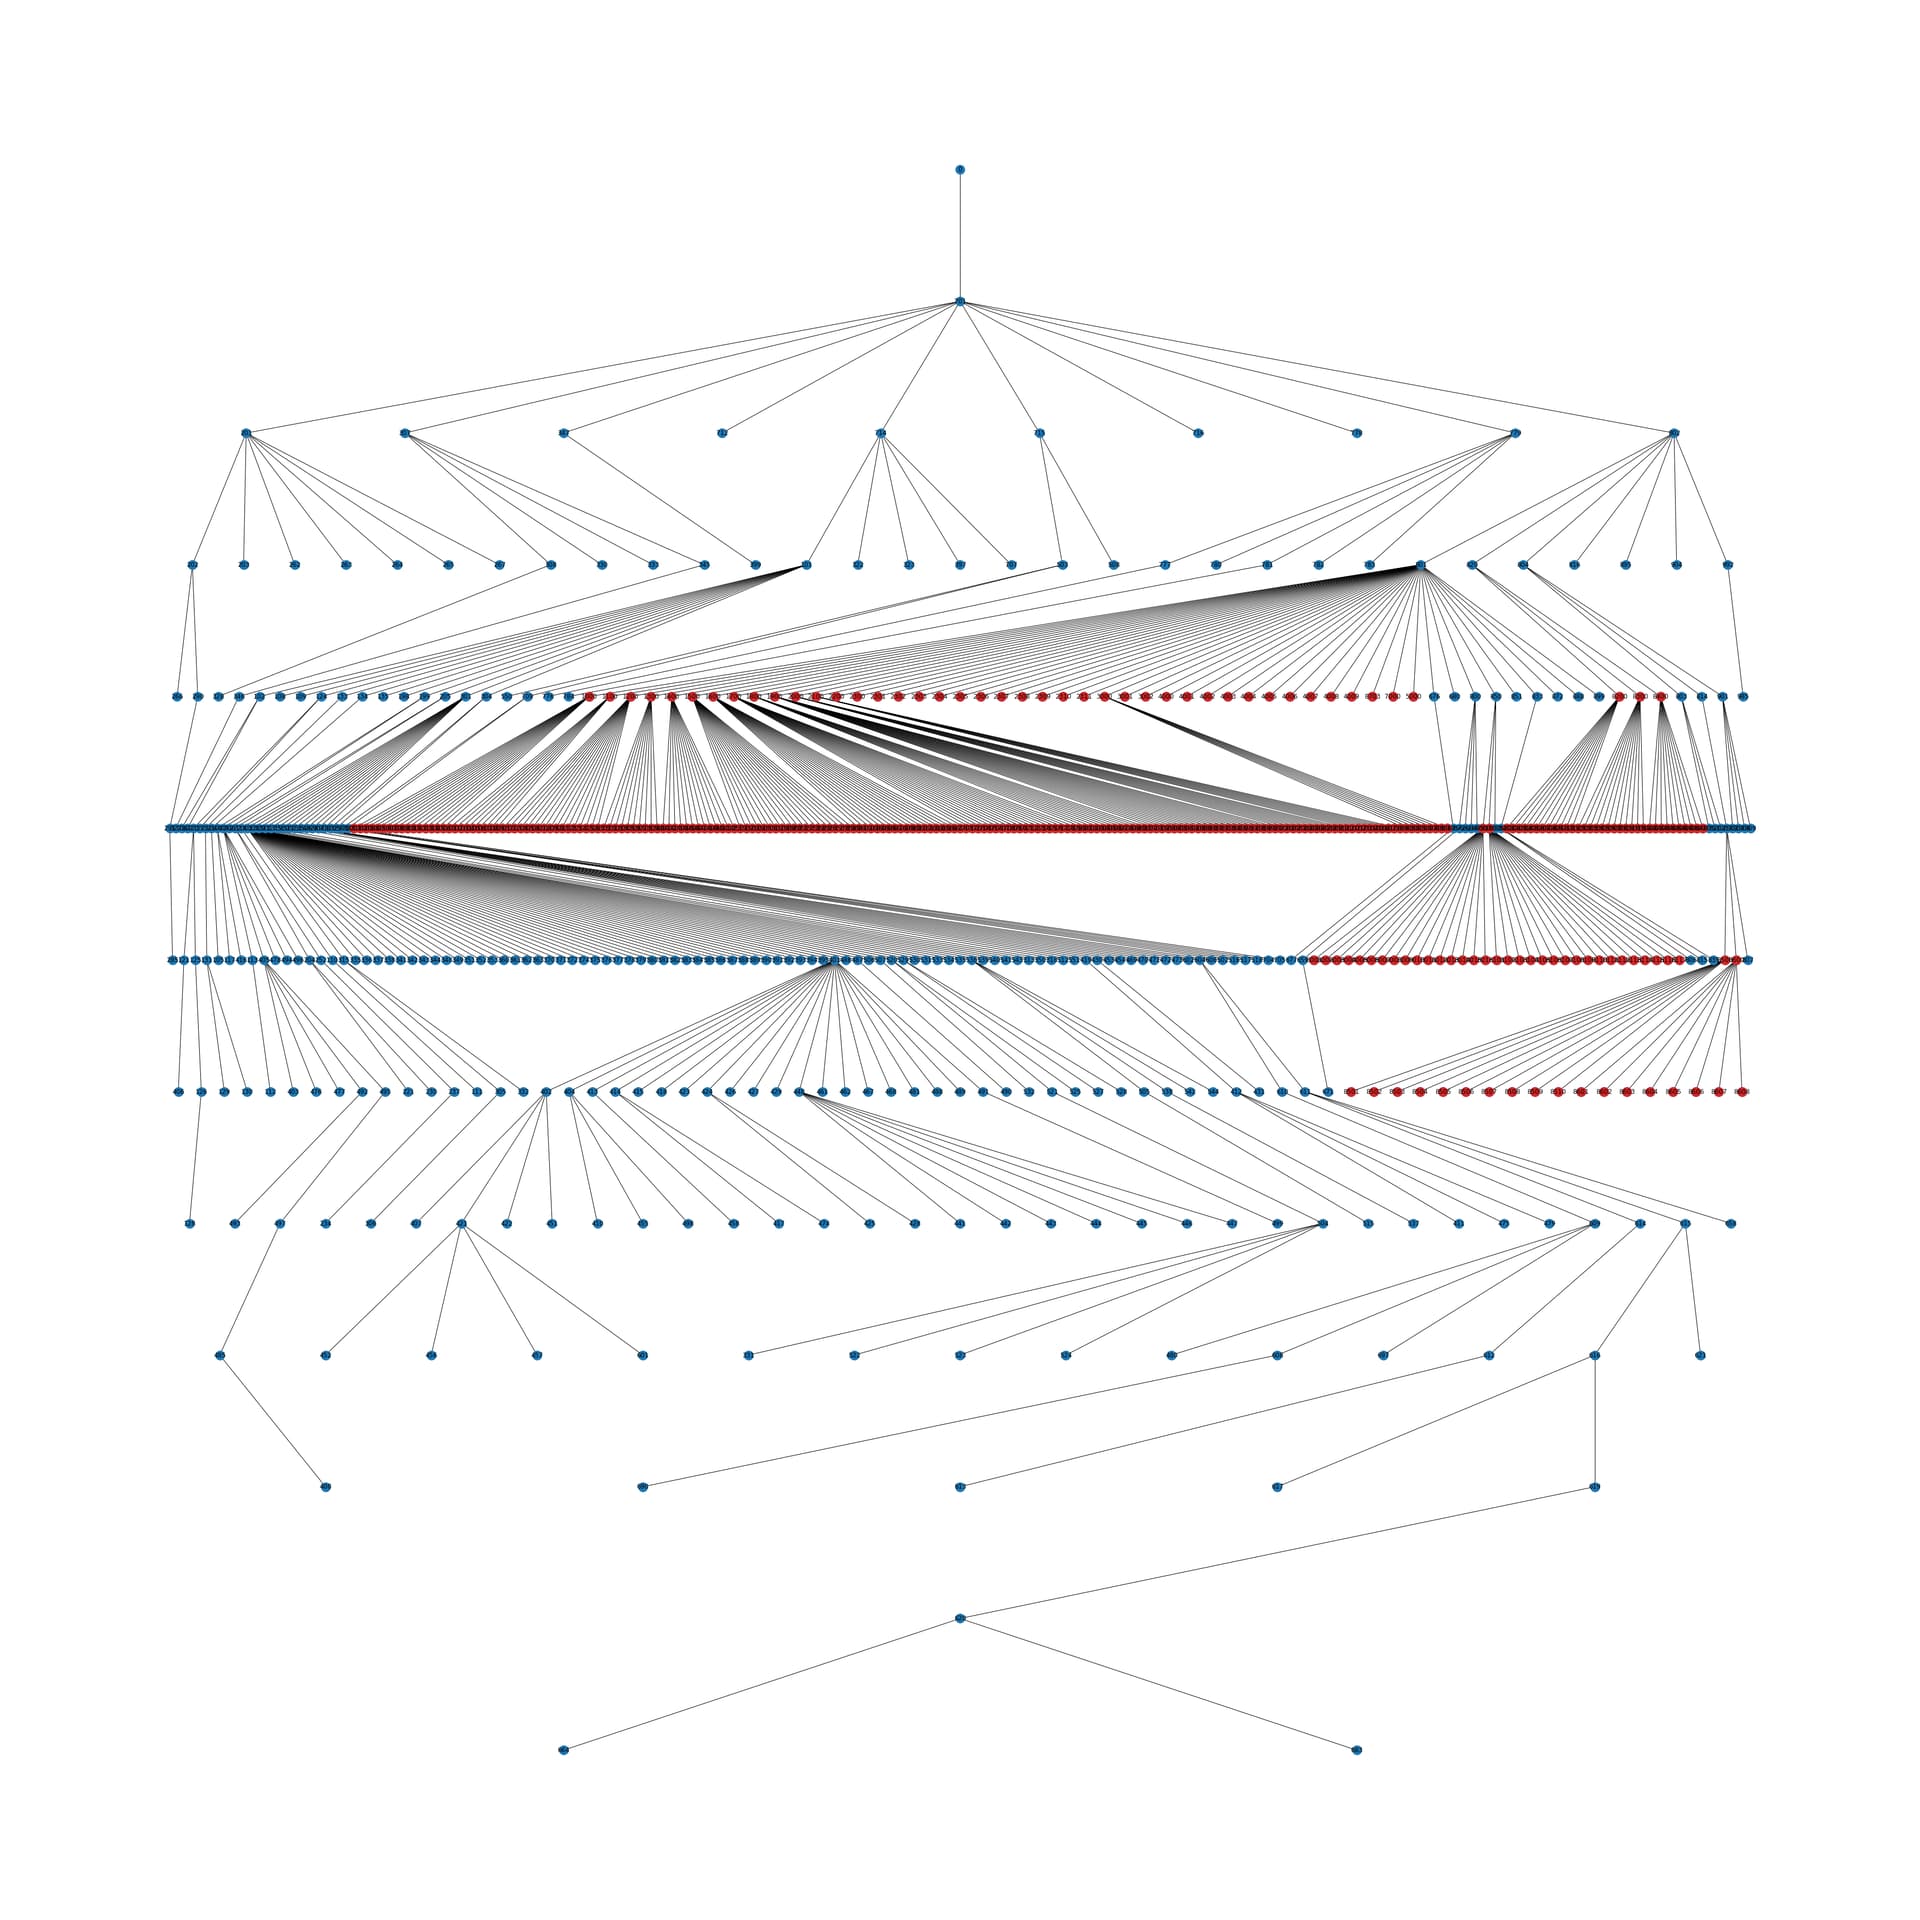
I set this aside for a while but I revisited it today and found some neat code to make a simple tree diagram from just a table of plateIDs and parentIDs. Here I’m showing two linked reconstruction trees. Not a perfect visualisation but like I said it is simple to do!