Hello all,
I am trying to recreate the .gif that’s on the gplately API page and the github page but I am having a difficult time getting the motion path to plot for only that time step. The code I have now plots the motion path for the entire history and not for each time stamp corresponding with the plate reconstruction. Any help would be appreciated to plot the motion path along with the plate reconstruction through time in a .gif. I think that’s what the .gifs are showing on the github/API documentation.
outdir = './tmp/'
if not os.path.exists(outdir):
os.mkdir(outdir)
oldest_seed_time = 100
time_step = 10
for time in np.arange(oldest_seed_time, -time_step, -time_step):
# Set up a GeoAxis plot
fig = plt.figure(figsize=(18,10), dpi=100)
ax = fig.add_subplot(111, projection=ccrs.Mollweide(central_longitude=-130))
ax.gridlines(color='0.7',linestyle='--', xlocs=np.arange(-180,180,15), ylocs=np.arange(-90,90,15))
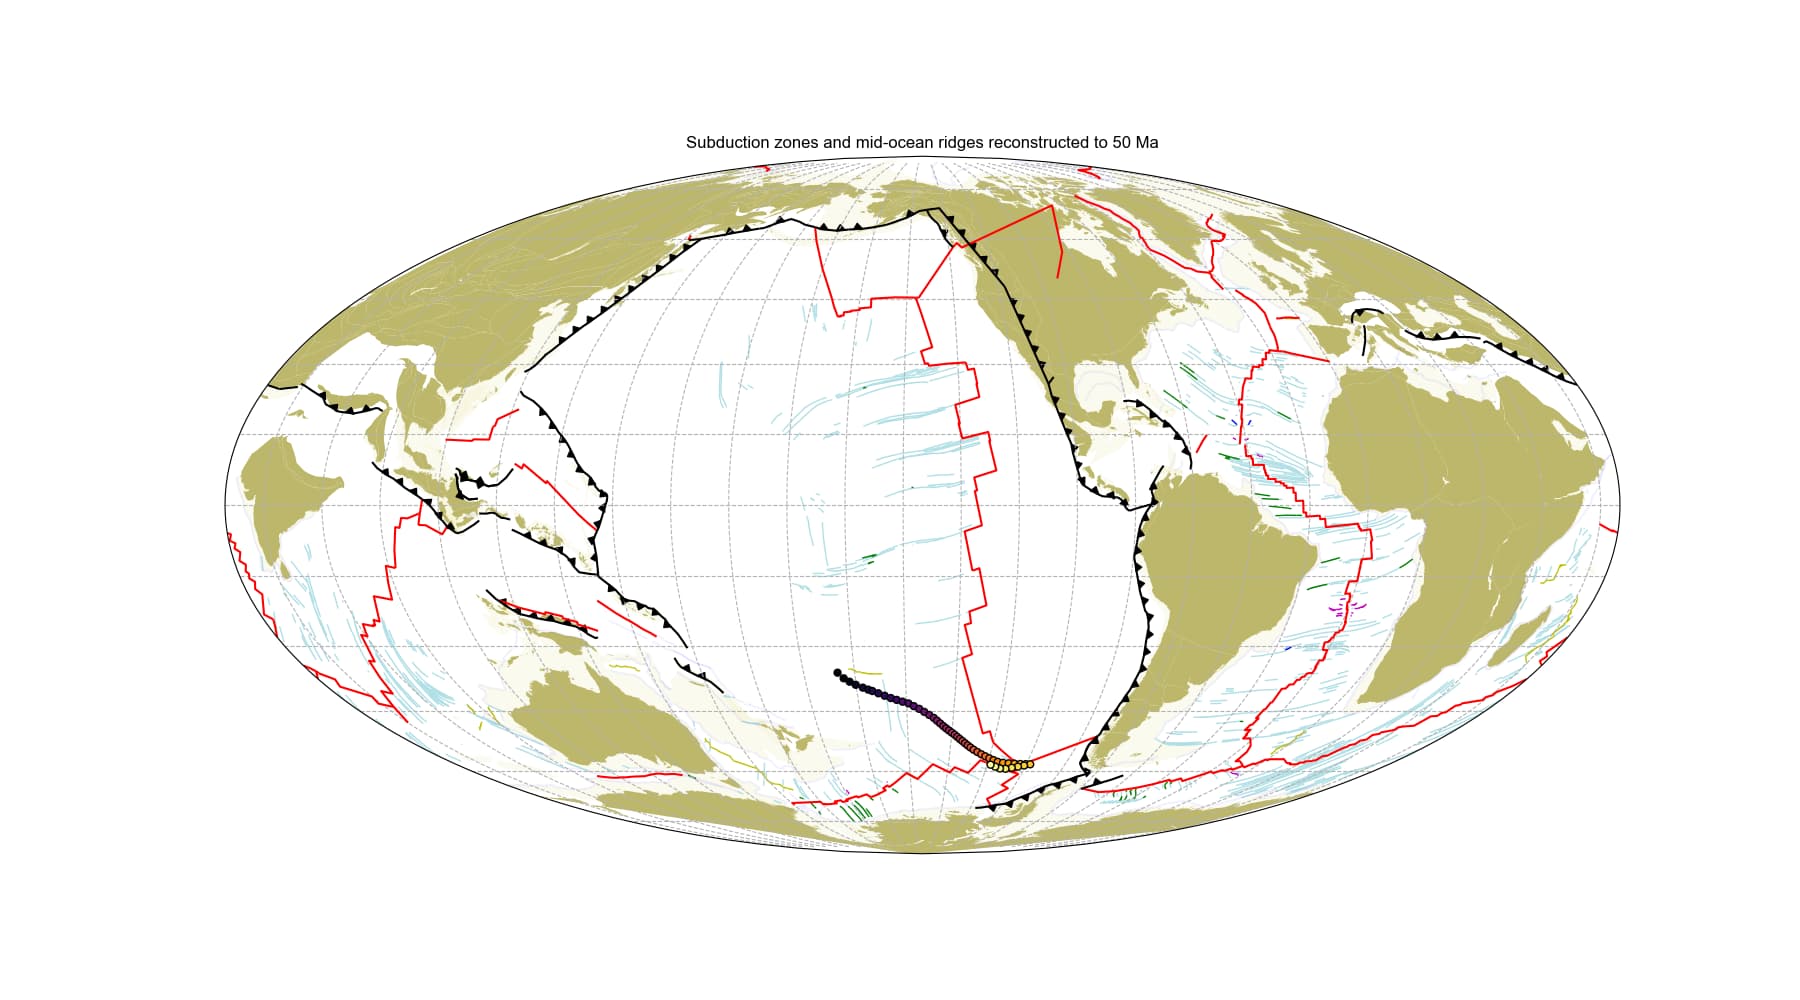
plt.title('Subduction zones and mid-ocean ridges reconstructed to %i Ma' % (time))
gplot.time = time
gplot.plot_continent_ocean_boundaries(ax, color='b', alpha=0.05)
gplot.plot_continents(ax, facecolor='palegoldenrod', alpha=0.2)
gplot.plot_coastlines(ax, color='DarkKhaki')
gplot.plot_ridges_and_transforms(ax, color='red')
gplot.plot_trenches(ax, color='k')
gplot.plot_subduction_teeth(ax, color='k')
ax.plot(lon360, lat, color='yellow', linewidth=0.75, transform=ccrs.PlateCarree(), zorder=3)
ax.scatter(lon360, lat, 100, marker='.', c=time_array, cmap=plt.cm.inferno, edgecolor='k',
transform=ccrs.PlateCarree(), vmin=time_array[0], vmax=time_array[-1], zorder=4)
ax.set_global()
plt.savefig(outdir + 'combined_reconstruction_motionpath_%d_Ma.png' % time)
plt.close()
print('Combined image for %d Ma saved' % time)