Thank you mchin!
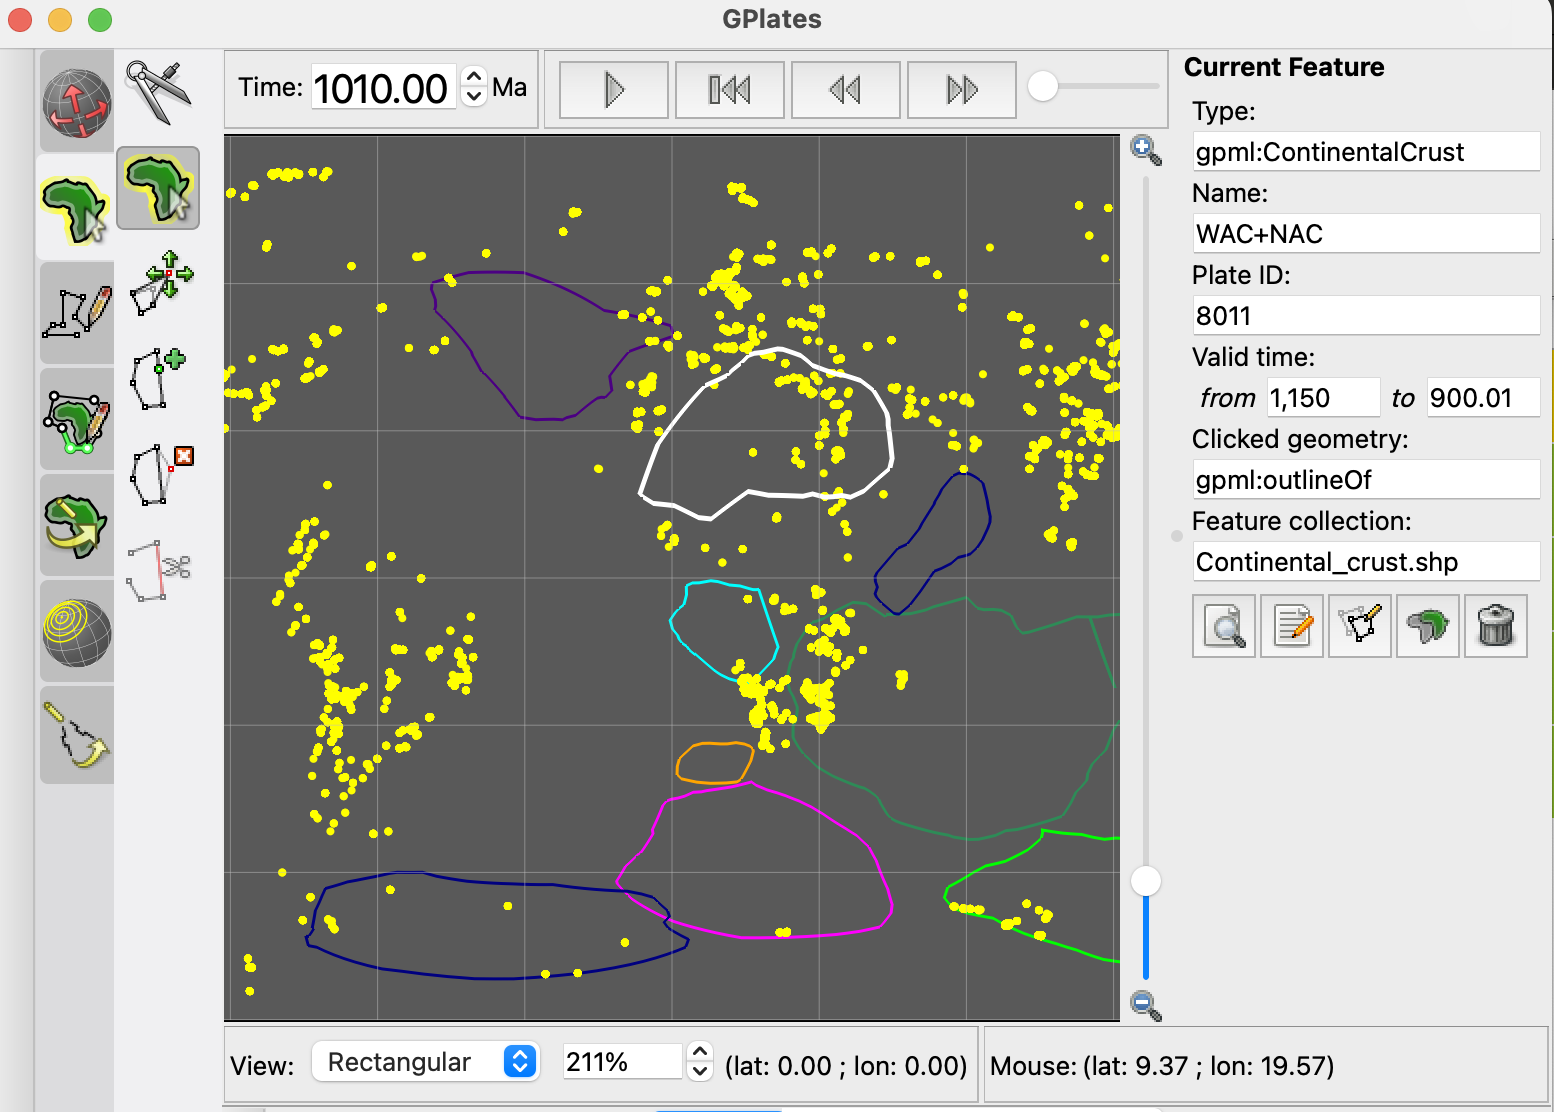
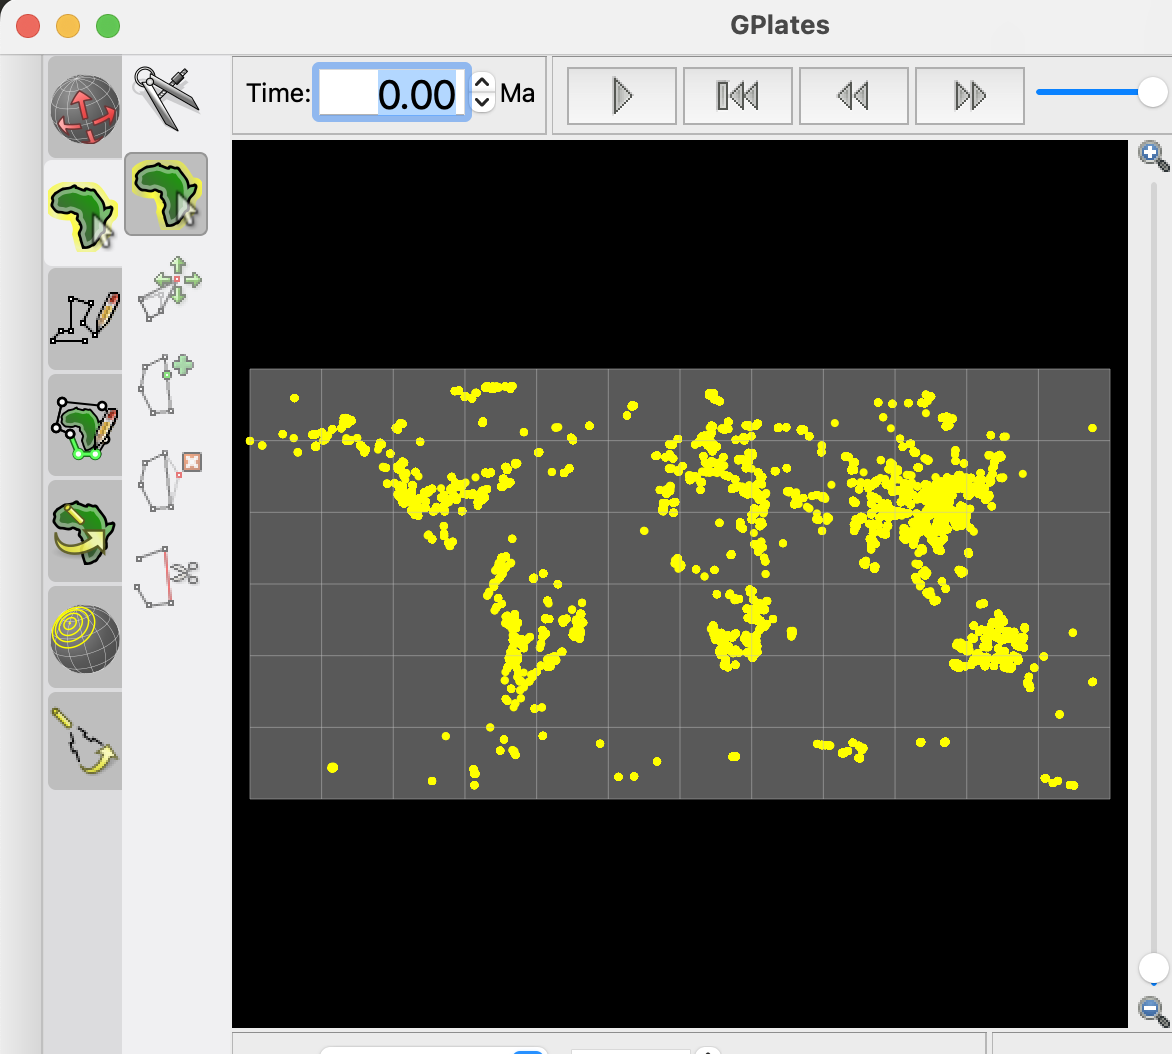
I am trying to reconstruct the latitude and longitude of 1000ma~2000ma, but pygplates returns me today’s latitude and longitude. But you may be right, maybe it’s because I used the wrong rotation file or static polygon file?
Sorry, I don’t know how to upload data files here, but the zircon data file can be found in this article, and the file from Li2023 can be found here, dataset 4.
Here is the code:
# %% import lib
import pandas as pd
import numpy as np
import pygplates

# %%
def reconstruct_coordinates(pygplates_recon_geom):
    rlats = []
    rlons = []
    for i in pygplates_recon_geom:
        # reconstructed coordinates
        recon_point = i.get_reconstructed_geometry()
        rlat, rlon = recon_point.to_lat_lon()
        rlats.append(rlat)
        rlons.append(rlon)
    return rlats, rlons

# %% Reconstruct zircon data with PyGPlates
# Let's import some plate reconstruction files, since we'll need this very soon.
rotation_filename = './plate-model-repo/li2023/EDRG_90W_2000-540Ma.rot'
# static_polygon_file = './plate-model-repo/li2023/EDRG_topology_90W_2000-540Ma.gpml'
# static_polygon_file = './plate-model-repo/li2023/EDRG_topology_90W_2000-540Ma.gpml'
static_polygon_file = './plate-model-repo/li2023/Continental_crust.shp'

# read into pygplates
rotation_model = pygplates.RotationModel(rotation_filename)
static_polygons = pygplates.FeatureCollection(static_polygon_file)
# %%
hf = pd.read_excel('data/41597_2023_2902_MOESM4_ESM.xlsx', sheet_name='Lu-Hf_Data')
# hf.columns.tolist()
# cols = ['Ref-Sample Key', 'Sample-ID', 'U-Pb    Age  (Ma)', 'εHf(t) calc', 'εHf(t) 2σ calc  ', 'Latitude', 'Longitude']
# hf = hf[cols]
# hf.dropna(axis=0, how='any', inplace=True)
age_min = 1000
age_max = 2000
age_range = age_max - age_min
hf = hf[(hf['U-Pb    Age  (Ma)'] >= age_min) & (hf['U-Pb    Age  (Ma)'] <= age_max)]
# split 1000 million years into 50 bins
nbins = 50
age_itv = age_range / nbins
binedges = np.linspace(age_min, age_max, nbins + 1)
hf['age_bin'] = pd.cut(hf['U-Pb    Age  (Ma)'], binedges, include_lowest=True, labels=np.arange(0, nbins))
hf.reset_index(drop=True, inplace=True)
# %% convert zircon data to gplates feature
zir_point_features = []

for index, row in hf.iterrows():
    point = pygplates.PointOnSphere(float(row.Latitude), float(row.Longitude))  # use the lat and lng columns as our coordinates
    zir_point_feature = pygplates.Feature()
    zir_point_feature.set_geometry(point)

    # set time the point is valid for
    zir_point_feature.set_valid_time(row['U-Pb    Age  (Ma)'] + 0.5 * age_itv, row['U-Pb    Age  (Ma)'] - 0.5 * age_itv)  # assign ages for each point
    zir_point_features.append(zir_point_feature)   # save to zir_point_features
# %% Assign plate IDs to the zircons data so that each point now has a plate ID.
# This can take a while for really large datasets

zir_cc = pygplates.partition_into_plates(static_polygons, rotation_model,
                                          zir_point_features,
                                          properties_to_copy = [pygplates.PartitionProperty.reconstruction_plate_id])
# output_points_filename = 'hf_zir_with_plate_ids.gpml'
# # Write the assigned point features to the output GPML file (ready for use in GPlates).
# assigned_point_feature_collection = pygplates.FeatureCollection(zir_cc)
# assigned_point_feature_collection.write(output_points_filename)

# %% reconstruct zircon hf
hf['rlat'] = np.nan
hf['rlon'] = np.nan
for i in range(nbins):
    reconstructed_zir_hf = []
    reconstruction_time = 1000 + (i + 1) * age_itv - 0.5 * age_itv
    hf_bin_idx = hf.loc[hf['age_bin'] == i].index.tolist()
    zir_cc_bin = [zir_cc[i] for i in hf_bin_idx]  # get the zircon features for each age bin
    pygplates.reconstruct(zir_cc_bin, rotation_model, reconstructed_zir_hf, reconstruction_time)
    rlats, rlons = reconstruct_coordinates(reconstructed_zir_hf)
    # print("length of rlats:", len(rlats), "length of rlons:", len(rlons), "length of hf_bin_idx:", len(hf_bin_idx))
    hf.iloc[hf_bin_idx, -2] = rlats
    hf.iloc[hf_bin_idx, -1] = rlons
# %%
hf.to_csv('hf_zir_reconstructed_1-2Ga.csv')
I’d appreciate it if you could tell me what happened!