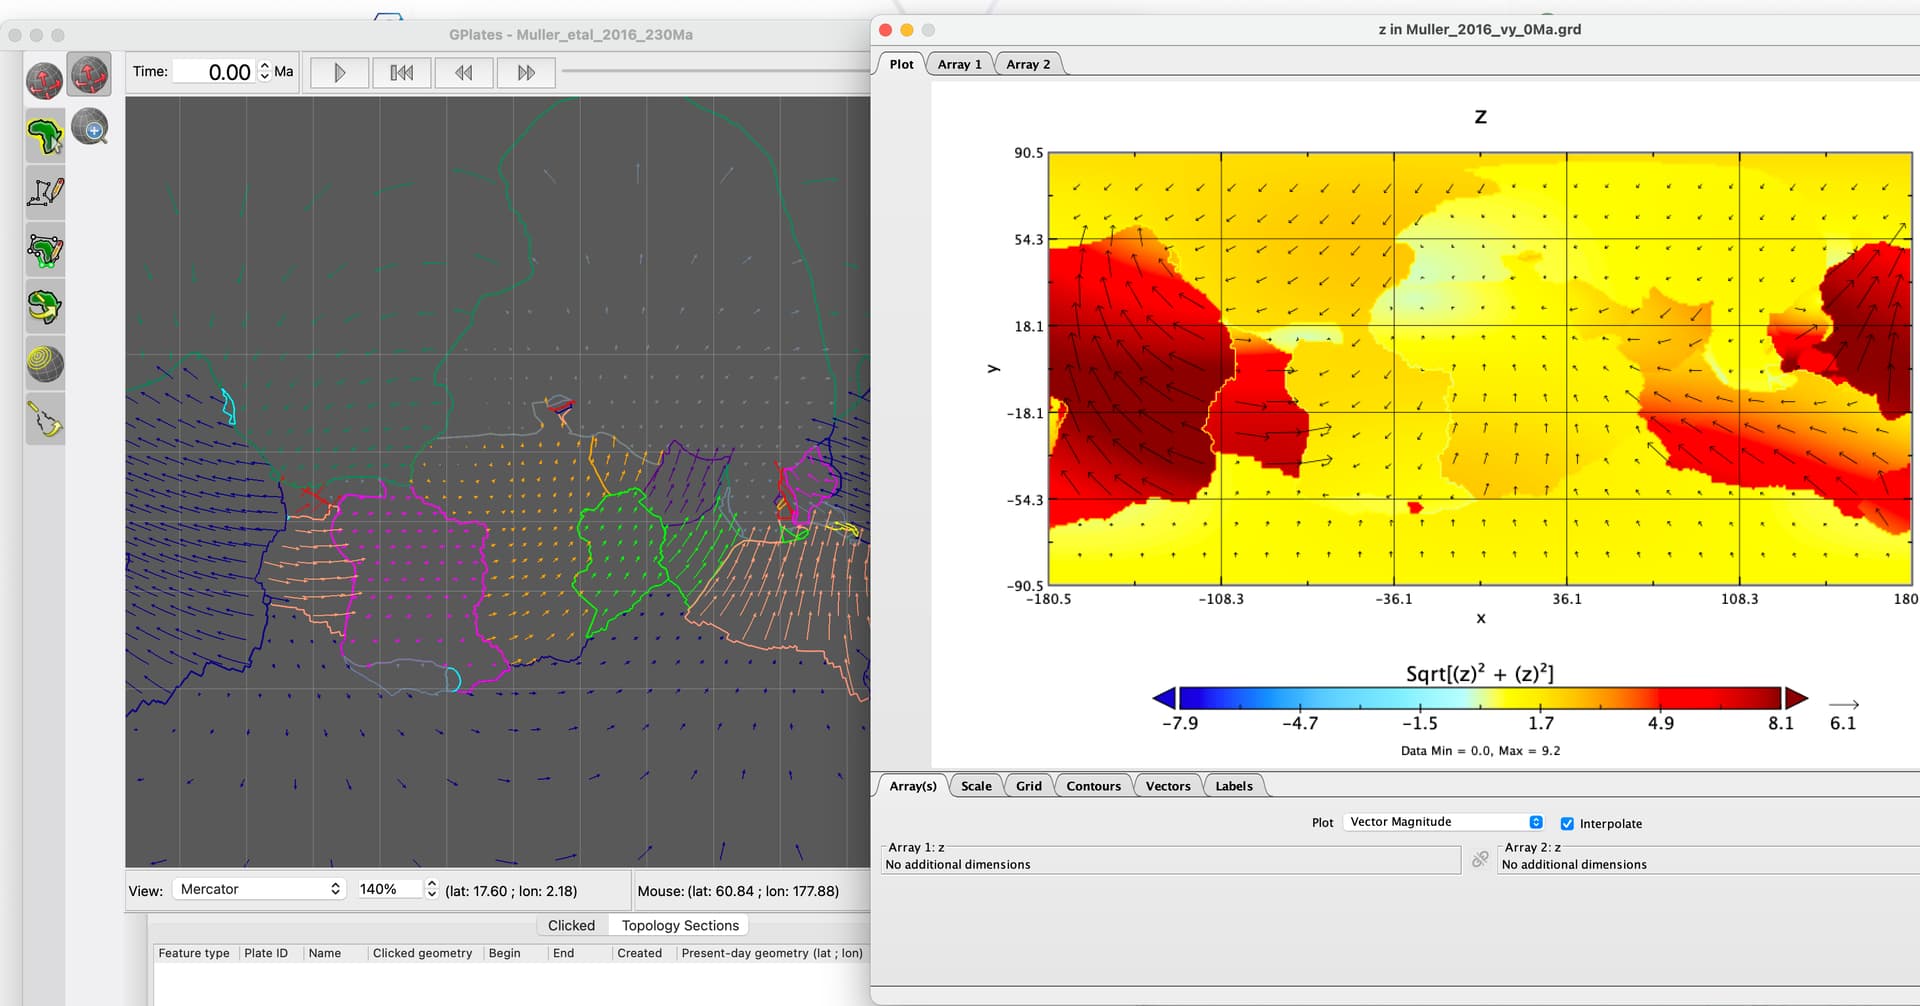
I’m a green hand with GPlates. When I try to export velocity vector by GPlates from the tutorials, I find the exoported data velocity vectors are different with GPlates snapshot. Where did I go wrong?
Sorry, new users can only upload one photo.
I’m a green hand with GPlates. When I try to export velocity vector by GPlates from the tutorials, I find the exoported data velocity vectors are different with GPlates snapshot. Where did I go wrong?
Hi KuidiZhang,
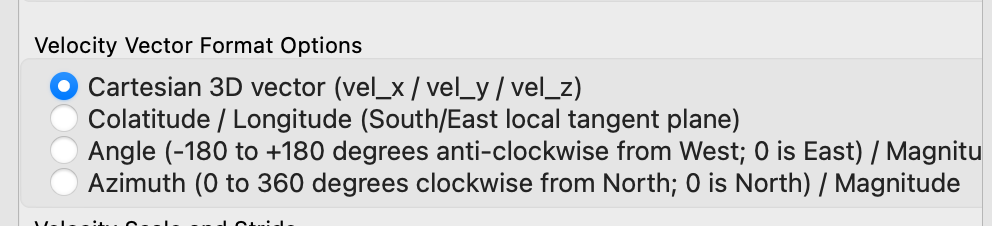
My guess would be something in how the exported data is interpreted in your Panoply. I’m not familiar with Panoply but maybe you exported from GPlates as Cartesian 3D vectors (x/y/z), instead of Azimuth, and Panoply is interpreting the x and y as longitude and latitude, or something like that.
Hi, John,
Thank you very much for your reply. I’m sure the exported data as Cartesian 3D vectors (x/y/z), there has no mistakes.
Hi John,
I think the problem which exported data is in Cartesian 3D coordinate rather than spherical coordinate. I exported data by CitcomS Points in CitcomS global(*) format and get vx and vy in plane. As you konw, the CitcomS format would divide the data into 12. So, I wonder how to export complete velocity data(lat lon vx vy) all at once. Looking forward your replay.
Maybe try setting Azimuth in your velocity export…
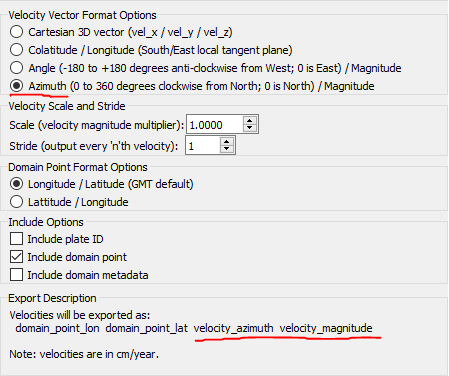
Yes, I do that. But I need to transform (v_azimuth, v_magnitude) to (vx, vy) by myself. How can I export (vx, vy ) directly?
Oh, I think you want Colatitude / Longitude (sorry, I confused myself on the CitcomS output)…
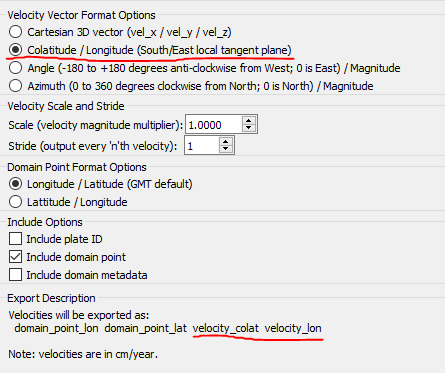
Thank you, John. I get it. I have tried exporting data in this format before, but I didn’t noticed that the format of data writing was different that of GMT, so I thought it was wrong data (as you konw, GMT is positive in North and East, GPlates is in South/East. )
The problem has been solved. Thank you again for your kind reply.