Dear esteemed GPlates community,
I hope this message finds you well. I am currently utilizing GPlates for my research; however, I must confess that my software coding proficiency is rather limited.
Based on the USGS Earthquake dataset, I have successfully created a GeoJSON file representing the locations of earthquakes with depths ranging from 70 to 300 km over the past 30 years. After importing this GeoJSON file into GPlates, my objective is to color-code each point according to its depth, with deeper events represented by darker hues.
Despite my best efforts to adjust various layer settings within GPlates, I have encountered significant difficulty in determining the appropriate method to display depth-dependent coloration. I would be immensely grateful for any guidance on this matter.
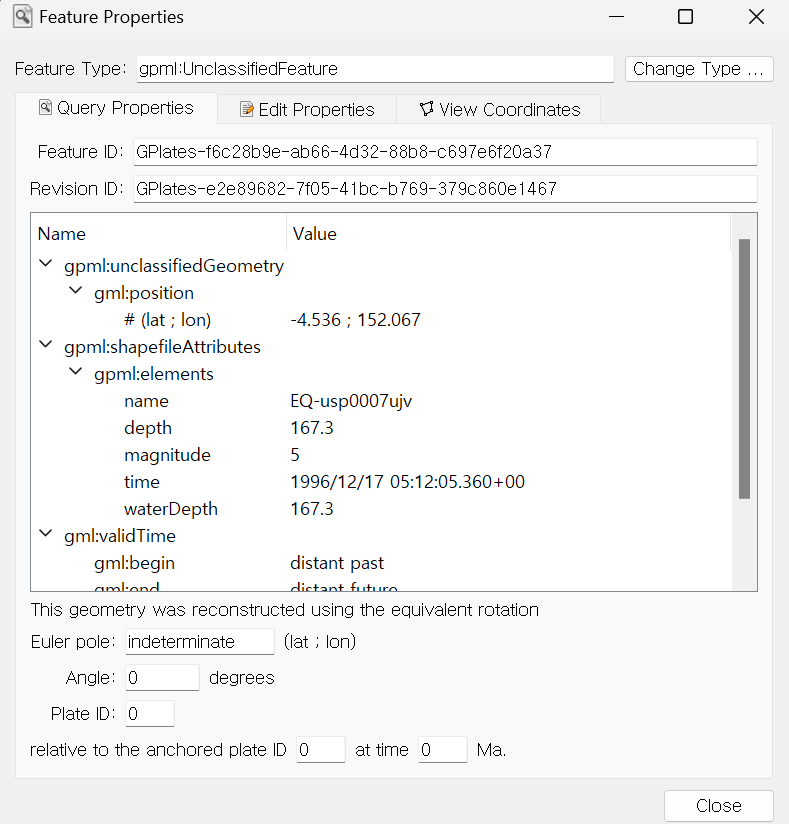
For clarity, I have attached an image:
A capture of the properties panel for a selected point, illustrating the structure of the data
Specifically, I aim to apply coloration based on the ‘depth’ value found within the gpml:shapefileAttributes section of each point’s properties.
As a novice user seeking to enhance my GPlates proficiency, I would be deeply appreciative of any insights, step-by-step instructions, or best practices that the more experienced members of this community might be willing to share. Your expertise could prove invaluable in advancing my research visualization capabilities.
Thank you in advance for your time and consideration. I look forward to learning from your collective wisdom.
