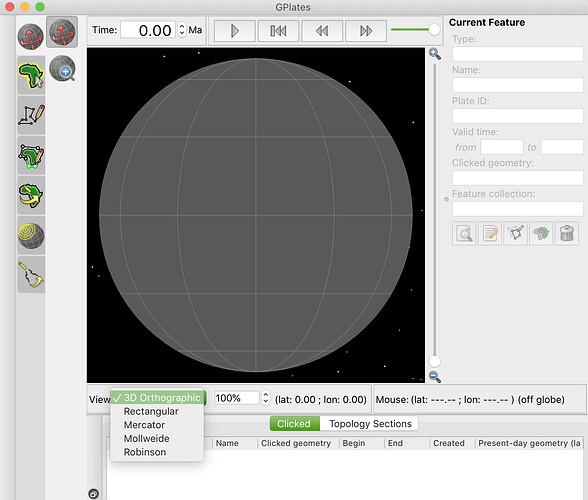
Hi, I’m very new to GPlates and I’m finding it quite hard to find resources on how to use the software that aren’t just a TA explaining a lab to university students on youtube, so excuse me if my question is very basic.
I am trying to build a world using the software, and in order to do so I first need to create a pattern on a globe, and then draw some basic elements on a Mercator projection with that pattern. I have used the circle and line features to draw this pattern, and now I would ideally have a png in the Mercator projection so that I can start the rest of the process.
When I try to export, the “Projected Geometries(and Rasters, 3D Scalar Feilds)” and “Image (screenshots)” options are what some places said I should use, but those only give me well… a screenshot.
I hope this is enough information to help understand my issue. If you know of how to do what I need or know where I can find the required resources to learn how to do it then I would appreciate the guidence.
Hi Nessie,
I reckon the easiest option for you would be to press CTRL+3 when you have GPlates open in order to switch your display to a Mercator projection (the same can also be achieved by clicking on the drop down menu on the bottom left and selecting “Mercator”):
From then on you should see the world in Mercator projection and all exports of screenshots as rasters or SVGs should now be in that projection.
Alternatively, you can also chose to export your features as “reconstructed geometries” as (vector) SHP files, fire up a GIS like QGIS or plot a basemap with those features using GMT in Mercator projection. Keep in mind that Mercator is not quite ideal for global scale maps due to the large distortions in high latitudes.
Cheers,
Christian
Thank you very much! This is very helpful.
I am looking to export to Transverse Mercator projection (meaning that the cylinder is rotated) and thus meridians are no more parallele (see https://en.wikipedia.org/wiki/Transverse_Mercator_projection. How can I do it?
Since the Transverse Mercator projection is essentially a rotation of the standard Mercator projection cylinder I suppose one hacky option is to introduce that equivalent rotation into your rotation file. Perhaps as a new plate ID relative to the normal anchor plate 0. And then select that new plate ID as the anchor plate.
Then use the Mercator projection in GPlates. However the grid lines would look wrong, so you’d need to turn them off (by setting the alpha channel of the grid line colour to zero). You could then create the grid lines as regular geometries yourself and load them in (they would also be correctly rotated by the non-zero anchor plate ID assuming they are assigned plate ID zero). I think someone has done this before but I can’t find it now.
In GPlates we’ve stuck with pseudo-cylindrical projections since they have global coverage, and based on a vertical cylinder since we can then do dateline clipping (around the longitude/latitude rectangle) so that things look correct in 2D map views (including exporting to other software like ArcGIS). Also, in the next GPlates supporting Vulkan graphics, the map projection will be hardware-accelerated (first converting 3D position to 2D lon/lat and then using 2nd order interpolation via textures into map projection space) - that means it’s fairly invested in that class of projections. So we don’t really support other projections (like you mentioned in your other thread).
You might find it easier to either save your dataset (in the File Manage datasets window) as a shapefile which will be in WGS84 projection by default. Then use any GIS software to read this in an reproject to Mercator if that is really what you need. In general, when working with GIS type data outside of GPlates itslef, it is best to use the WGS84 projection since GPlates also fully understands this when you want to bring things back from GIS into Gplates.
Bruce
