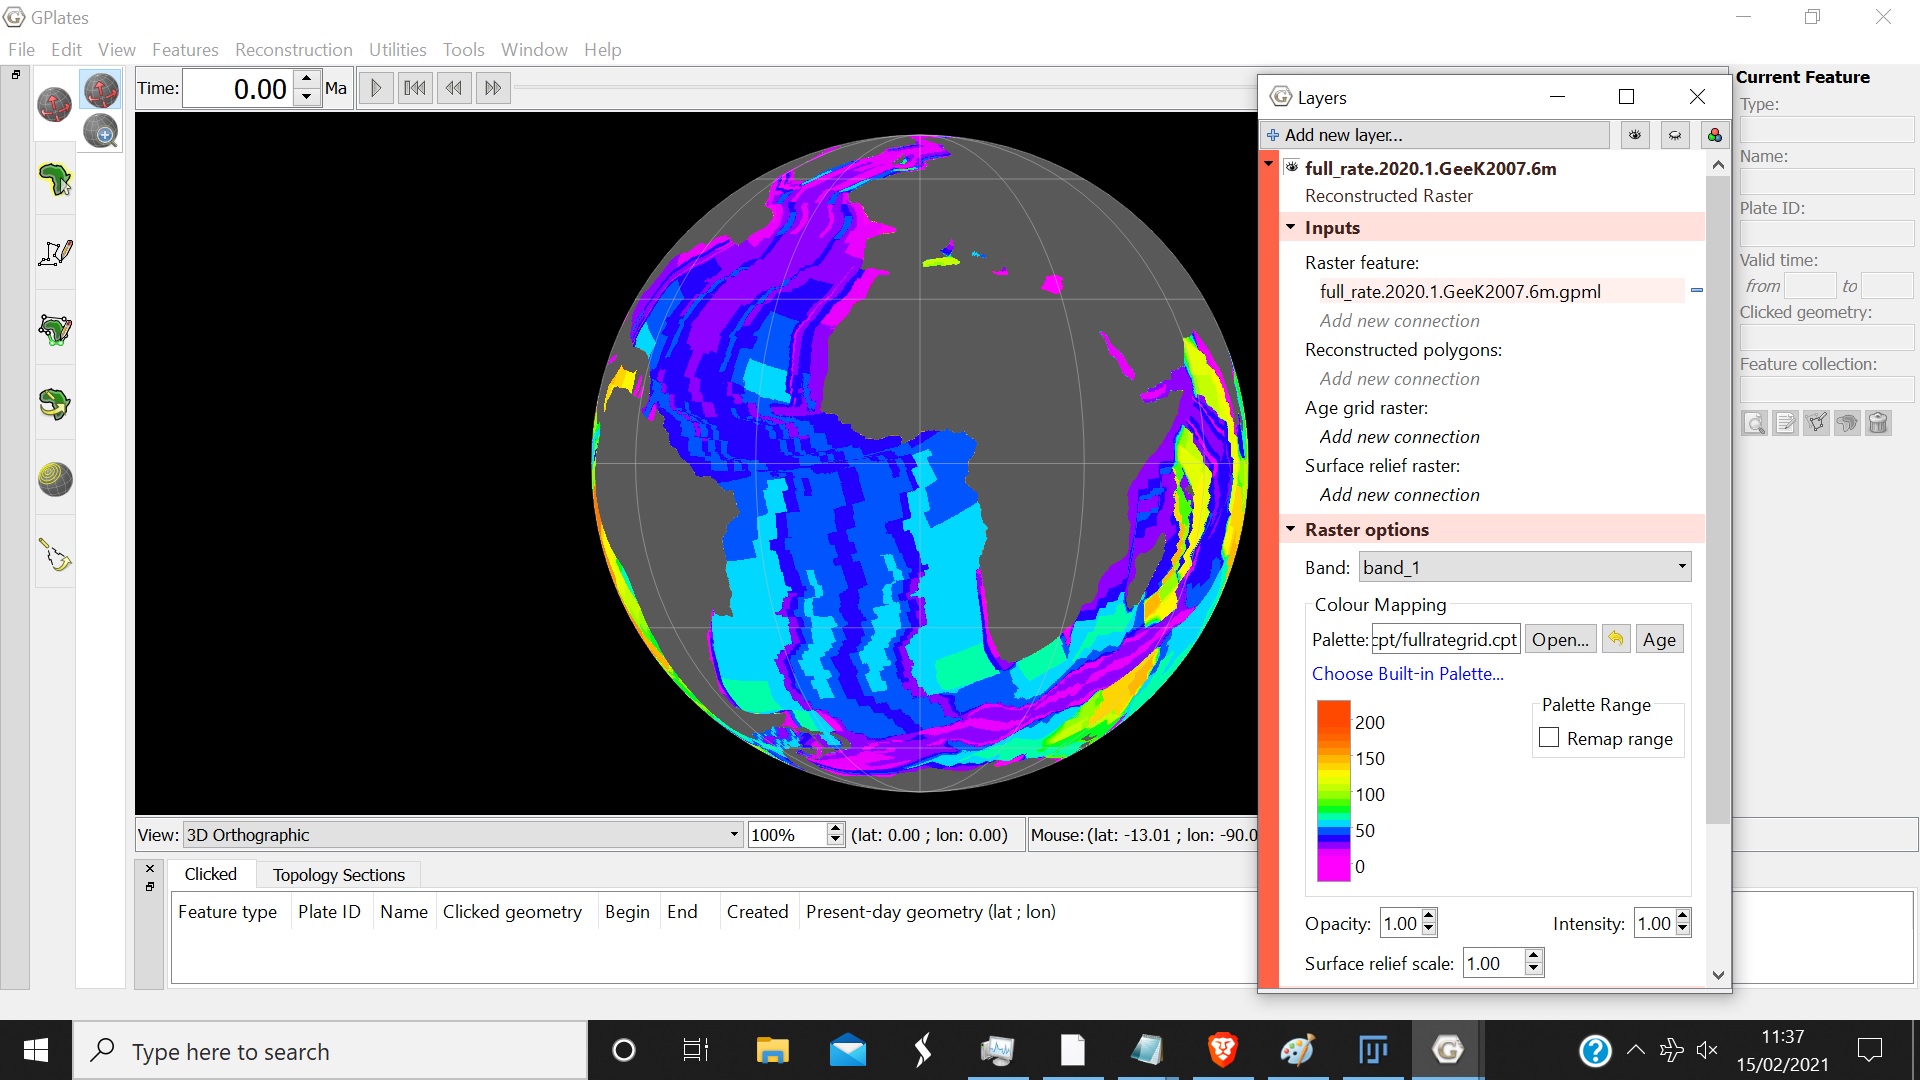
There are more than 20 colour slices in the palette, and the markings aren’t lined up to mark every 5 slices, so I’m not sure how to read it. I.e. 50 and 100 aren’t resting on one particular slice. Why isn’t 0 at the very beginning? What values would correspond to the slices beneath 0?
Also, as you can see, in the screenshot, after unticking ‘remap range’ the palette shrinks significantly. I’m finding it really difficult to actually see the individual slices with it being that small. I can make out some of the slices, but the ones at the top and bottom appear to blend together - making it hard to see the individual slices.
So the z value is just the incremental number, i.e. if the colour slice values increase by 10 mm/yr then the z value is 10? Does that mean that values falling in between the increments of 10, i.e. 126 mm/yr, would be assigned their own colour slice in between the increments?
Let me know if the screen shots that I’ve attached look correct.
Thanks