Hello,
I am using GPlates 2.5.0 on Windows and I am trying to apply colours to a shapefile layer using the ColorByProperty draw style, but the colours are not being applied to the map.
My setup:
- Layer: a polygon shapefile (MAA_PJM1997_pGEOG.shp)
- The shapefile has an attribute field called “ID” with discrete integer values: 10, 20, 30, 40 and 333
- I created a CPT file with the following content:
10 142 217 114 20 186 227 31
20 186 227 31 30 195 194 95
30 195 194 95 40 129 123 11
40 129 123 11 333 170 224 234
What I did in GPlates:
- Opened the layer panel and clicked “Set Draw style…”
- Selected ColorByProperty from the list
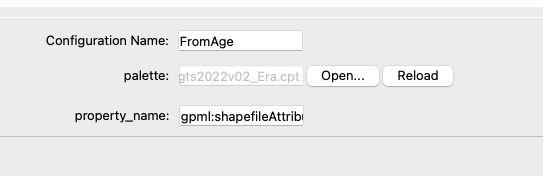
- Clicked Add… to create a new configuration
- Loaded the CPT file using Open…
- Set property_name to “ID”
- Clicked Reload and closed the window
The thumbnail in the Draw Style window shows the new configuration selected (blue border), but the map does not change colours at all.
My questions:
- Is “ID” the correct value for property_name when working with shapefile attributes?
- Is the CPT format I am using correct for GPlates 2.5.0?
- Is there an additional step needed to apply the style to the map?
Thank you in advance.